Monday, February 27, 2012

Playing with the Summary Advisor


The goal for this posting is to do a quick experiment with the new OBIEE 11.1.1.6 feature "Summary Advisor" based on what I had a chance to learn about it and to document the steps:  For this I'll be using an "Exalyticless" setup with the following components
11.1.1.6
TimesTen 
Oracle db
First there are few required steps that have to be done in TimesTen, the OBIEE RPD and the Weblogic enterprise manager.
TimesTen:
Download 
Installation Guide
Once TimesTen is installed, create a new connection in SQL*Plus or SQL Developer. Once connected,  create a new user that will be used by the Admin Tool to connect to TimesTen.  

create user bi11g identified by Admin123;
grant create table to bi11g;
grant select on SYS.OBJ$ to bi11g;
grant create session to bi11g;

Create a new connection to SQL Developer for bi11g and a table BI_TABLE. BI_TABLE will be used to test the connection pool for the Summary Advisor 
Name: BI_TABLE1
Column Name: COLUMN1 (VARCHAR2(4000))

Add one row of data just for testing

OBIEE Admin Tool
Log into the Admin Tool and create a connection pool to the TimesTen instance, this will be used by Summary Advisor as a target data store.
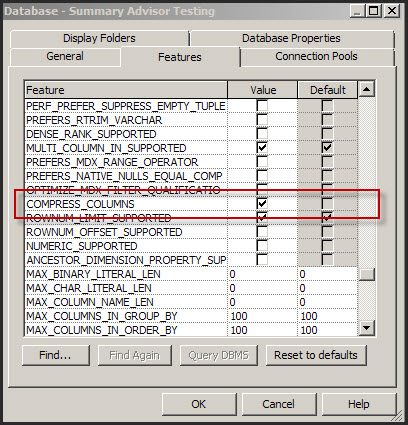


Enable the COMPRESS_COLUMNS to cause the Summary Advisor to create aggregates in TimesTen using the Compressed Columns capability.

WL Enterprise Manager
  • Need to make sure that the Usage Tracking parameters and the Summary Advisor settings are set correctly. 
  • Log into WL enterprise manager and navigate to the “System MBean Browser”

  • Navigate to the BIDomain.BIInstance.ServerConfiguration 

We need to make sure that the values are in sync with the repository settings.
Now that we’re done with the settings, we can test our system without the Summary Advisor feature implemented; this will serve as a reference that will be used for comparison once the Summary Advisor is implemented. This will be the topic of a future posting.

a+
Fiston


Usage Tracking in OBIEE 11.1.1.6

In case you haven't noticed yet, Usage Tracking is now a system managed attribute in 11.1.1.6, you can no longer directly configure this using the NQSCONFIG.INI file. 
To configure Usage Tracking, log into WL enterprise manager and 

  • Expand the WebLogic Domain and the bifoundation_domain .

  • Right-click on the Admin Server and select "System MBean Browser."

  • Navigate to the MBean in the following tree:
    • Application Defined Mbeans
      •  oracle.biee.admin
        •  BIDomain.BIInstance.ServerConfiguration

        List of configuration settings

a+
Fiston

Box and Whiskers Plot using R and BIP

 I’ve just started experimenting with R in conjunction with BI-Publisher. R provides various statistical packages and plotting utilities and there are numerous resources on the web dedicated to it. The goal is to take a generate a plot using R and render it in BI-Publisher. The installation steps for R enterprise are covered in the Oracle® R Enterprise User's Guide, the main steps are: 


  • Install the R server ((LINUX/UNIX)

To connect to R enterprise from R client run the following:
ore.connect(user = "",sid = "",host = "",password = "",port = PORTNUMBER)
# Synchronize R with user's schema in Oracle
ore.sync()
# Attach environment containing visible Oracle tables and views
# to the search path
ore.attach()
Modify (user, sid, host, password, and port) for the database where the R Server is installed

  • Create the R script

As an example, I’ll generate a box and whiskers plot using the ONTIME_S airline on-time performance data. Box and whiskers plots are not available out of the box in BI-Publisher.  The plot will use a subset of the dataset to focus on the DMV Airports: Reagan Airport (DCA), Dulles Airport (IAD) and Baltimore Washington airport (BWI) for 2007 and 2008.
Below is the R script that generates the plot:

f <-function(){
  ontime <- ONTIME_S
  delay <- ontime$ARRDELAY[ontime$DEST %in%  c("BWI", "IAD", "DCA") & ontime$YEAR %in% c(2007,2008)]
  dest <- ontime$DEST[ontime$DEST %in%  c("BWI", "IAD", "DCA") & ontime$YEAR %in% c(2007,2008)]
  dest <- reorder(dest, delay, FUN = median)
  bd <- split(delay, dest)
  res <- boxplot(bd, ylim=c(-50,60),col=c( "darkolivegreen","coral3","cornflowerblue"),main="Flight Delays by Airport",  xlab="Airport", ylab="Delay (minutes)")
}
f()


The R script has to be modified a bit to "escape" the "&" sign (in red), if not ontime will be considered a prompted parameter. This script can be run using SQL*Plus.
 BEGIN
sys.rqScriptCreate('DMVAirports',
'f <-function(){
  ontime <- ONTIME_S
  delay <- ontime$ARRDELAY[ontime$DEST %in%  c("BWI", "IAD", "DCA") '||'&'||' ontime$YEAR %in% c(2007,2008)]
  dest <- ontime$DEST[ontime$DEST %in%  c("BWI", "IAD", "DCA") '||'&'||' ontime$YEAR %in% c(2007,2008)]
  dest <- reorder(dest, delay, FUN = median)
  bd <- split(delay, dest)
  res <- boxplot(bd, ylim=c(-50,60),col=c( "darkolivegreen","coral3","cornflowerblue"),main="Flight Delays by Airport",  xlab="Airport", ylab="Delay (minutes)")
}  ');
END;
/

  • Create a BI-Publisher data model using the following query:


select value from table(rqEval(NULL,'XML','DMVAirports'))


You can list all the available R functions in the database by running:
select name from  sys.rq_scripts

  • Change the VALUE field from CLOB to XML
  • Generate some sample XML
  • Create a new template using BI-Publisher Desktop and insert the field img with the following properties:  


  •  Create a PDF output et voila!!!


Too bad I live 10 mins from the airport with the worse performance!

For more information, tutorials visit:

a+
Fiston

Tuesday, February 21, 2012

OBIEE 11.1.1.6 new features/enhancements


New features/enhancements, good stuff

  • Auto-Complete Functionality for Prompts:  When enabled by the administrator, auto-complete suggests and highlights matching prompt values as the user types in the prompt selection field
  • Optional Apply and Reset Buttons for Prompts:  You can show or hide a prompt's apply and reset buttons.
  • Miscellaneous Prompts Enhancements:  The prompt Reset button now provides three reset options: Reset to last applied values, Reset to default values, and Clear All.
  • Favorites:  You can now bookmark as favorites the catalog objects
  • Customizable Global Header and Get Started:  The order of the links on the global header can now be customized, and links to external locations can be added to the global header. The Get Started... section of the home page can also be customized to meet the informational needs of the users
  • Oracle BI Client Installer Option Added to the Home Page:  A link to the Oracle BI Client Installer has been added to the Download BI Desktop Tools option (just like it is for BI-Publisher Desktop)
  • Integrated Full-Text Search Capabilities:  This method of searching allows the user to find objects by searching on their attributes such as author and column name
  • Ability to Set Accessibility Mode in the Sign In Page:   Facilitates the use of a screen reader.
  • Enhancement to Oracle Scorecard and Strategy Management
  • Oracle Business Intelligence Mobile
  • Enhancements to Tables and Pivot Tables
  • Enhancements to Map Views:  You can now include non-BI layers on a map view
  • Enhancements to Selections:  The ability to include selected members in hierarchy selections steps that are based on family relationships,  the addition of Siblings of and Leaves of options in family relationships.
  • Enhancements to Views:  The ability to rename views and compound layouts
  • BI Composer Enhancements: BI Composer is now available in regular mode as well accessibility mode

OBIEE 11.1.1.1.6 available for download

I just learned that 11.1.1.6 is now available for download. Following are the major new features in the Administration Tool:


  • Ability to Limit and Offset Rows Returned
  • Identify Query Candidates with Oracle BI Summary Advisor
  • Integrate the Administration Tool with a Third-Party Source Control Management System
  • Streamlined MUD Merge Process
  • Automated Repository Patching Process
  • Support for Aggregate Persistence in a Cluster
  • Ability to Print the Physical and Business Model Diagrams

No doubt that in the coming hours there will be a flurry of new postings dealing with new features